Main
Start of topic | Skip to actions
Information for others on pulling Carocoops data to other websites, etc.
WLS1 - FRP1 (NWLON ID 8668498) location: 32.45 N, 80.45 W
WLS2 - CAP1 (NWLON ID 8664941) location: 32.68 N, 79.68 W
WLS3 - SUN1 (NWLON ID 8659897) location: 33.86 N, 78.51 W
===Buoys 10 meter depth:
buoy2 - FRP2 (NDBC ID 41033) location: 32.27 N, 80.40 W
buoy4 - CAP2 (NDBC ID 41029) location: 32.80 N, 79.62 W
buoy6 - SUN2 (NDBC ID 41024) location: 33.83 N, 78.48 W
===Buoy 30 meter depth:
buoy5 - CAP3 (NDBC ID 41030) location: 32.50 N, 79.32 W
http://carocoops.org/carocoops_website/buoy_detail.php?buoy=buoy6 graph page - defaults to daily graphs
http://carocoops.org/carocoops_website/buoy_graph.php?buoy=buoy6 Note when calling the buoy_graph.php page the session parameters(arguments after the ?) are
http://carocoops.org/carocoops_website/content/buoy6/content_part6.html graphical element for air temperature day graph for air temperature
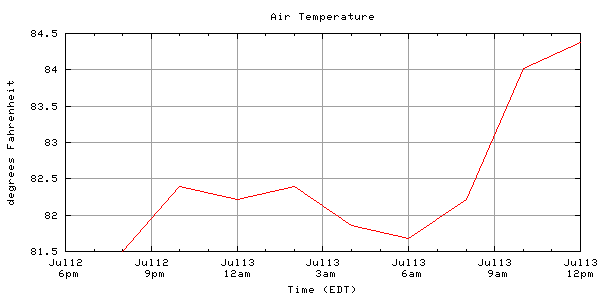 valid time substitutes for '1_day' are 1_week, 1_month, 1_year, 3_days, 3_months
http://carocoops.org/carocoops_website/buoy_query.php?platform_id=buoy6 Note when calling the buoy_query.php page the session parameters (arguments after the ?) are
to top
Regularly generated data
Data is usually reported every two hours for the buoys and every 15 minutes for the water level stations. A suggested subscription frequecy would be the top of the hour for buoys and the every quarter hour for water level stations. The html snippets, graphics and the 1 day, 3 days graphs are updated with each report. The graphs for the week, month, 3 month and year are updated nightly. In general all the website platform(station,buoy) content can be found under either the following two folders:html frame snippets with links, quick display(flash) pages
http://carocoops.org/carocoops_website/content The html snippets do contain links to the corresponding carocoops data, but this link will generate in a new browser window so the user does not lose their browser context.regularly generated graphics, graphs
http://nautilus.baruch.sc.edu/carocoops_website/images/EN/ The naming correspondence between the folders and the platforms is as follows: ===Water level stations:WLS1 - FRP1 (NWLON ID 8668498) location: 32.45 N, 80.45 W
WLS2 - CAP1 (NWLON ID 8664941) location: 32.68 N, 79.68 W
WLS3 - SUN1 (NWLON ID 8659897) location: 33.86 N, 78.51 W
===Buoys 10 meter depth:
buoy2 - FRP2 (NDBC ID 41033) location: 32.27 N, 80.40 W
buoy4 - CAP2 (NDBC ID 41029) location: 32.80 N, 79.62 W
buoy6 - SUN2 (NDBC ID 41024) location: 33.83 N, 78.48 W
===Buoy 30 meter depth:
buoy5 - CAP3 (NDBC ID 41030) location: 32.50 N, 79.32 W
Examples
The following examples reference the SUN2 buoy, but could reference any platform with the appropriate substitution for 'buoy6'. Note that the buoy_detail.php and buoy_graph.php pages self refresh every 15 minutes with the intent being to allow others to setup a browser display which after it is setup will continue displaying current information. detail page - graphical readout for platformhttp://carocoops.org/carocoops_website/buoy_detail.php?buoy=buoy6 graph page - defaults to daily graphs
http://carocoops.org/carocoops_website/buoy_graph.php?buoy=buoy6 Note when calling the buoy_graph.php page the session parameters(arguments after the ?) are
buoy_id= buoy2, buoy4, buoy5, buoy6, WLS1, WLS2, WLS3
graph_type= all, <specified observation depending on platform>
interval= 1_day, 1_week, 1_month, 1_year, 3_days, 3_months
html snippet
http://carocoops.org/carocoops_website/content/buoy6/content_part6.html graphical element for air temperature
http://nautilus.baruch.sc.edu/carocoops_website/images/EN/buoy6/graphic/temperature_sky.png
day graph for air temperature
http://nautilus.baruch.sc.edu/carocoops_website/images/EN/buoy6/graph/1_day_air_temperature.png
valid time substitutes for '1_day' are 1_week, 1_month, 1_year, 3_days, 3_months
Query and Download data
query and download pagehttp://carocoops.org/carocoops_website/buoy_query.php?platform_id=buoy6 Note when calling the buoy_query.php page the session parameters (arguments after the ?) are
platform_id= buoy2, buoy4, buoy5, buoy6, WLS1, WLS2, WLS3
observation_id= <specified observation depending on platform, see below listing for public and internal observations>
default
$observation_select_list_public = array(
                'group_1'          =>  ' - All Platforms',
                'wind' =>  'wind speed, gust and direction',
                'air_temperature' =>  'air temperature',
                'air_pressure' =>  'air pressure',
                'group_2'  =>  ' - Instrument Moorings',
                'depth' =>  'depth',
                'temperature_bottom' =>  'water temperature at bottom',
                'salinity_bottom' =>  'salinity at bottom',
                'current_surface' =>  'current speed, direction at surface',
                'current_surface_speed' =>  'current speed at surface',
                'current_bottom' =>  'current speed, direction at bottom',
                'current_bottom_speed' =>  'current speed at bottom',
                'humidity' =>  'relative humidity',
                'solar' =>  'solar radiation',
                'group_4'  =>  ' - Near-shelf CAP2',
                'visibility' =>  'visibility',
                'group_5'  =>  ' - Mid-shelf CAP3,SUN3',
                'chlorophyll' =>  'chlorophyll at surface',
                'temperature_surface' =>  'water temperature at surface',
                'salinity_surface' =>  'salinity at surface',
                'group_6'          =>  ' - Water Level Stations',
                'water_level' =>  'water level',
                'water_temperature' =>  'water temperature'
                );
use 'obs=internal' in the http arguments
$observation_select_list_internal = array(
                'all'      =>  ' - All Platforms',
                'battery'  =>  'battery',
                'wls'      =>  ' - Water Level Stations',
                'nitrogen_pressure'  =>  'nitrogen pressure',
                'battery_secondary'  =>  'battery secondary',
                'wind_secondary'  =>  'wind secondary',
                'humidity'  =>  'relative humidity',
                'im'       =>  ' - - Instrument Moorings',
                'temp'     =>  'temperature',
                'position' =>  'position',
                'clock_diff' =>  'clock difference'
                );
time_interval= specify, 1_day, 1_week, 1_month, 1_year, 3_days, 3_months
fromDate= <MM/DD/YYYY>
toDate= <MM/DD/YYYY>
submit_type= PlotGraph, ShowData, DownloadData
Example showing water level surge during Hurricane Charley August 14-15, 2004
http://nautilus.baruch.sc.edu/carocoops_website/buoy_query.php?platform_id=WLS3&observation_id=water_level&time_interval=specify&fromDate=08/14/2004&toDate=08/15/2004&submit_type=PlotGraph
Future plans
I'd like to provide a session parameter switch on the buoy_query.php such as 'output=basic' so that others could fold the results of a URL query more easily into their content without having to first strip the surrounding carocoops webpage content. Also planning to add rss and xml feeds similar to NWS (see http://weather.gov/data/current_obs/seek.php?state=sc&Find=Find ) -- JeremyCothran - 07 Jan 2025to top
Edit | Attach image or document | Printable version | Raw text | More topic actions
Revisions: | r1.5 | > | r1.4 | > | r1.3 | Total page history | Backlinks
Revisions: | r1.5 | > | r1.4 | > | r1.3 | Total page history | Backlinks