Main
Start of topic | Skip to actions
These are some default Xenia based web displays/products for a NERRS north inlet met and water platform. These represent products that can stand 'as-is' or be merged/re-published in other web contexts.
##############
Note that pages suffixed '_en' reference the 'english' instead of metric units of measure.
Most new data is available hourly.
#### nerrs_northinlet_met ####
# latest readout(includes links to graphs)
http://nautilus.baruch.sc.edu/data/nerrs/platform/nerrs_northinlet_met/html/latest_en.php #english units
http://nautilus.baruch.sc.edu/data/nerrs/platform/nerrs_northinlet_met/html/latest.php #metric units
# latest graphs(includes links to older graphs, table readout for past 3 days, monthly csv archive) The '3 days' graph changes with each new hourly measurement, whereas the longer term graphs (week, month, year) change once a (day, week, month). The longer term graphs all look the same right now since on this database I only have measurements from Nov 15 forward. #english units
http://nautilus.baruch.sc.edu/data/nerrs/platform/nerrs_northinlet_met/html/graph_en.php?time_interval=3_days
#metric units
http://nautilus.baruch.sc.edu/data/nerrs/platform/nerrs_northinlet_met/html/graph.php?time_interval=3_days # monthly csv archive(includes times in both EST/EDT, GMT and both english, metric units) Each month is regenerated with the latest days measurement every morning at 4 AM until that month is complete. File names suffixed YYYY_MM.csv (like 2006_11.csv) http://nautilus.baruch.sc.edu/data/nerrs/platform/nerrs_northinlet_met/archive #### content http://nautilus.baruch.sc.edu/data/nerrs/platform shows the two platforms currently available for nerrs: http://nautilus.baruch.sc.edu/data/nerrs/platform/nerrs_northinlet_met
http://nautilus.baruch.sc.edu/data/nerrs/platform/nerrs_northinlet_water each of these folders contains the following folders: archive, graph, html, xml The readout html can be referenced into another webpage from a link like
http://nautilus.baruch.sc.edu/data/nerrs/platform/nerrs_northinlet_met/html/latest_en.html The graph images can be referenced into another webpage from a link like
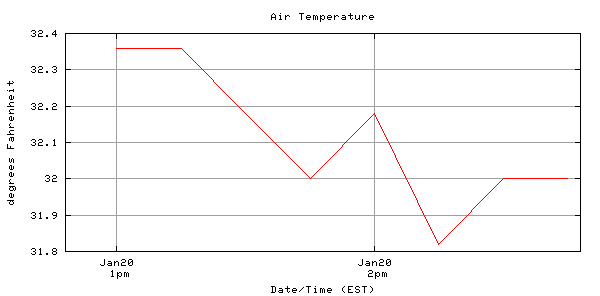
http://nautilus.baruch.sc.edu/data/nerrs/platform/nerrs_northinlet_met/graph/air_temperature:fahrenheit:3_days.png
which corresponds to the below graph
 There is an xml file which is also hourly produced which shares the latest platform observations in an xml format (this can be useful to other websites that might want to re-publish the same data on their website)
http://nautilus.baruch.sc.edu/data/nerrs/platform/nerrs_northinlet_met/xml/latest_obs.xml #### scripts http://carocoops.org/xenia
http://carocoops.org/xenia/readme_NI.txt -- JeremyCothran - 22 Nov 2025
to top
http://nautilus.baruch.sc.edu/data/nerrs/platform/nerrs_northinlet_met/html/latest.php #metric units
# latest graphs(includes links to older graphs, table readout for past 3 days, monthly csv archive) The '3 days' graph changes with each new hourly measurement, whereas the longer term graphs (week, month, year) change once a (day, week, month). The longer term graphs all look the same right now since on this database I only have measurements from Nov 15 forward. #english units
http://nautilus.baruch.sc.edu/data/nerrs/platform/nerrs_northinlet_met/html/graph_en.php?time_interval=3_days
#metric units
http://nautilus.baruch.sc.edu/data/nerrs/platform/nerrs_northinlet_met/html/graph.php?time_interval=3_days # monthly csv archive(includes times in both EST/EDT, GMT and both english, metric units) Each month is regenerated with the latest days measurement every morning at 4 AM until that month is complete. File names suffixed YYYY_MM.csv (like 2006_11.csv) http://nautilus.baruch.sc.edu/data/nerrs/platform/nerrs_northinlet_met/archive #### content http://nautilus.baruch.sc.edu/data/nerrs/platform shows the two platforms currently available for nerrs: http://nautilus.baruch.sc.edu/data/nerrs/platform/nerrs_northinlet_met
http://nautilus.baruch.sc.edu/data/nerrs/platform/nerrs_northinlet_water each of these folders contains the following folders: archive, graph, html, xml The readout html can be referenced into another webpage from a link like
http://nautilus.baruch.sc.edu/data/nerrs/platform/nerrs_northinlet_met/html/latest_en.html The graph images can be referenced into another webpage from a link like
There is an xml file which is also hourly produced which shares the latest platform observations in an xml format (this can be useful to other websites that might want to re-publish the same data on their website) http://nautilus.baruch.sc.edu/data/nerrs/platform/nerrs_northinlet_met/xml/latest_obs.xml #### scripts http://carocoops.org/xenia
http://carocoops.org/xenia/readme_NI.txt -- JeremyCothran - 22 Nov 2025
to top
Edit | Attach image or document | Printable version | Raw text | More topic actions
Revisions: | r1.2 | > | r1.1 | Total page history | Backlinks
Revisions: | r1.2 | > | r1.1 | Total page history | Backlinks